Understanding Z-Scores and Their Significance in Machine Learning
Written on
Chapter 1: Introduction to Z-Distribution
In this discussion, we will delve into the Z-score, a fundamental method for standardizing data to a common scale. It indicates how far a data point deviates from the mean, potentially yielding both positive and negative values based on the mean and standard deviation.
The Z-score represents the distance of a data point from the mean in terms of standard deviations. The formula for calculating the Z-score is as follows:
z = frac{(datapoint - mean)}{standarddeviation}
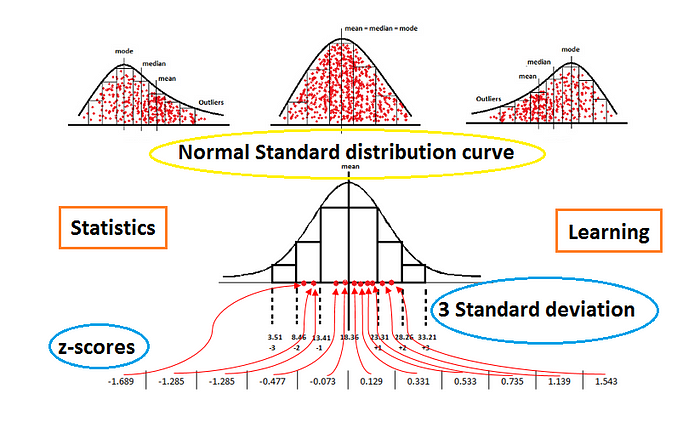
The Z-score is particularly relevant in the context of a normal distribution, which is symmetrical with no left or right skew.

Understanding Normal Distribution
- Normal Distribution: This curve illustrates a symmetrical spread of data around the mean.
- Right Skew: In this scenario, data is predominantly on the right, leading to outliers also being primarily on this side.
- Left Skew: Conversely, when data leans to the left, the outliers are mostly found on this side.
Mean and Standard Deviation
- Mean: This represents the average of the dataset, indicating the central tendency.
- Standard Deviation: It measures the dispersion of data points around the mean, with one standard deviation encompassing the spread of values.
To illustrate the concept, consider the following raw data:
The mean can be calculated as follows:
mean = frac{totalsumofvalues}{totalnumberofdata} = frac{202}{11} approx 18.36
To visualize the distribution, we can plot a curve alongside the data points.
- Variance: This indicates the average of the squared differences from the mean.
- Standard Deviation: By taking the square root of the variance, we obtain the standard deviation.
The following image illustrates the steps for calculating the standard deviation, highlighting one standard deviation from the mean in green.
The distribution of data indicates that:
- 1 standard deviation captures approximately 68% of the data,
- 2 standard deviations encompass about 95%,
- 3 standard deviations account for nearly 99.7%.
After calculating the Z-scores for all data points, we can construct the standard deviation distribution curve, showcasing the spread of data relative to their Z-scores.
Application of Z-Scores in Machine Learning
The use of Z-scores in machine learning is essential for:
- Standardizing data as a step in data preprocessing.
- Comparing Z-score values across different standard distributions to enhance analytical outcomes.
Conclusion
This article serves as an introduction to the standard deviation distribution curve and the significance of standard scaling in data preprocessing for machine learning algorithms.
I hope you found this information helpful. Feel free to connect with me on LinkedIn and Twitter.
Recommended Articles
- 8 Active Learning Insights of Python Collection Module
- NumPy: Linear Algebra on Images
- Exception Handling Concepts in Python
- Pandas: Dealing with Categorical Data
- Hyper-parameters: RandomSearchCV and GridSearchCV in Machine Learning
- Fully Explained Linear Regression with Python
- Fully Explained Logistic Regression with Python
- Data Distribution using NumPy with Python
- Decision Trees vs. Random Forests in Machine Learning
- Standardization in Data Preprocessing with Python
Chapter 2: Videos on Z-Score Applications
The concept of the Z-score is further explored in the following video, which discusses Normal Distribution and Z-Score in the context of math and statistics for data science and machine learning.
This video details the applications of the Z-score, particularly focusing on its importance in statistical interviews and how it can be utilized effectively.